
WMAP Frequency Coverage
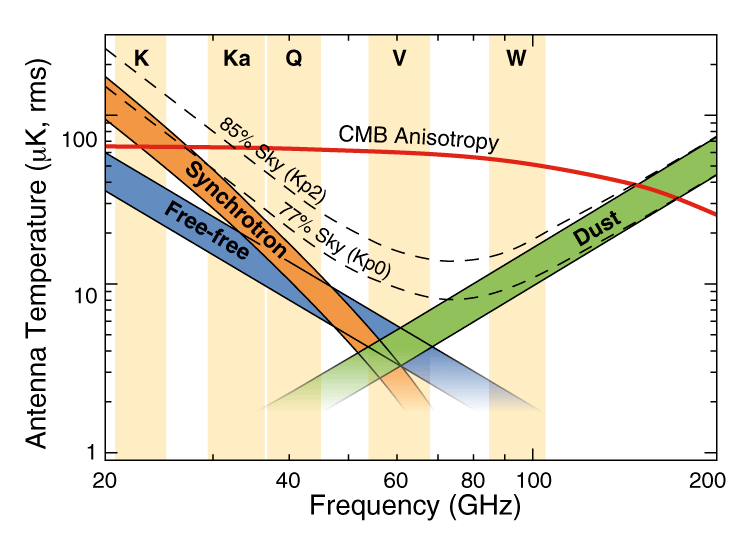
Galactic foreground signals are distinguishable from CMB anisotropy by their differing spectra and spatial distributions. Multiple frequency coverage is needed to reliably separate Galactic foreground signals from CMB anisotropy. WMAP observes with five frequency bands between 22 and 90 GHz.
There are two techniques that WMAP uses to evaluate and remove the Galactic foreground. The first uses existing Galactic maps at lower (radio) and higher (far-infrared) frequencies as foreground emission templates. Uncertainties in the original data and position-dependent spectral index variations introduce errors with this technique. There is no good free-free emission template because there is no frequency where it dominates the microwave emission. However, high resolution, large scale maps of H-alpha emission serve as a template for the free-free emission in regions where it has been mapped.
The second technique is to form linear combinations of multi-frequency WMAP observations such that signals with specified spectra are canceled. The linear combination of multi-frequency data makes no assumptions about the foreground signal strength or spatial distribution, but requires knowledge of the spectra of the foregrounds. Both techniques were successfully employed by COBE (e.g., Kogut et al.).
If one is willing to assume something about the angular power spectra of the foreground emissions (based on observations at lower and higher frequencies), then the multi-frequency combination method can be generalized to the two-dimensional space of frequency spectra and angular power spectra with a substantial increase in sensitivity. However, the technique that has been used most frequently on actual CMB data is the template fitting method.
Five frequency bands with comparable sensitivity are necessary to solve for the five possible signals: synchrotron, free-free, dust, CMB anisotropy, and perhaps spinning dust. The range of frequency coverage is more important than the specific choice of frequencies within the range. The lowest frequency to survey from space should be at the 22 GHz atmospheric water line since frequencies below this can (with some difficulty) be accurately measured from the ground. The highest frequency to survey should be ~100 GHz to reduce the dust contribution and minimize the number of competing foreground signals. The choice of frequencies between 22 and 100 GHz were dictated by the practical consideration of standard waveguide bands. Based on these considerations, WMAP observes in the following five frequency bands, which are indicated on the above plot:
| Microwave Band | K | Ka | Q | V | W |
|---|---|---|---|---|---|
| Frequency (GHz) | 22 | 30 | 40 | 60 | 90 |
| Wavelength (mm) | 13.6 | 10.0 | 7.5 | 5.0 | 3.3 |