
Parameters of Cosmology: Microwave Background Fluctuation Spectrum
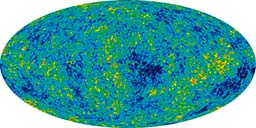
When WMAP measures the temperature of the CMB radiation over the full sky, it sees a nearly, but not exactly, uniform glow - there will be variations, or fluctuations, across the sky, like ripples on a pond. There are a number of different effects that can produce temperature variations in the microwave background: variations in the density or velocity of the gas at the surface of last scatter (i.e., sound waves), variations in the gravitational potential of the universe at the surface of last scatter as well as variations in the gravitational potential along the photon path. Different physical phenomena are responsible for each of these effects. By studying the microwave background fluctuations we can infer a wealth of information about the early universe.
By measuring the CMB temperature in progressively smaller and smaller patches of the sky, variations are measured in terms of an "angular fluctuation spectrum", or the amplitude or strength of temperature fluctuations as a function of angular size. Cosmologists can very easily represent this complex idea with a simple wiggly line across a graph. The graph produced by the WMAP science team is shown below. This plot shows a plateau at large angular or length scales, then a series of coherent peaks at progressively smaller scales. These features are generated by the various physical processes that produce different amounts of energy (temperature) at the different angular scales.This graph line will change as one varies the details of the physical processes; and the physical processes are controlled by fundamental cosmological parameters.
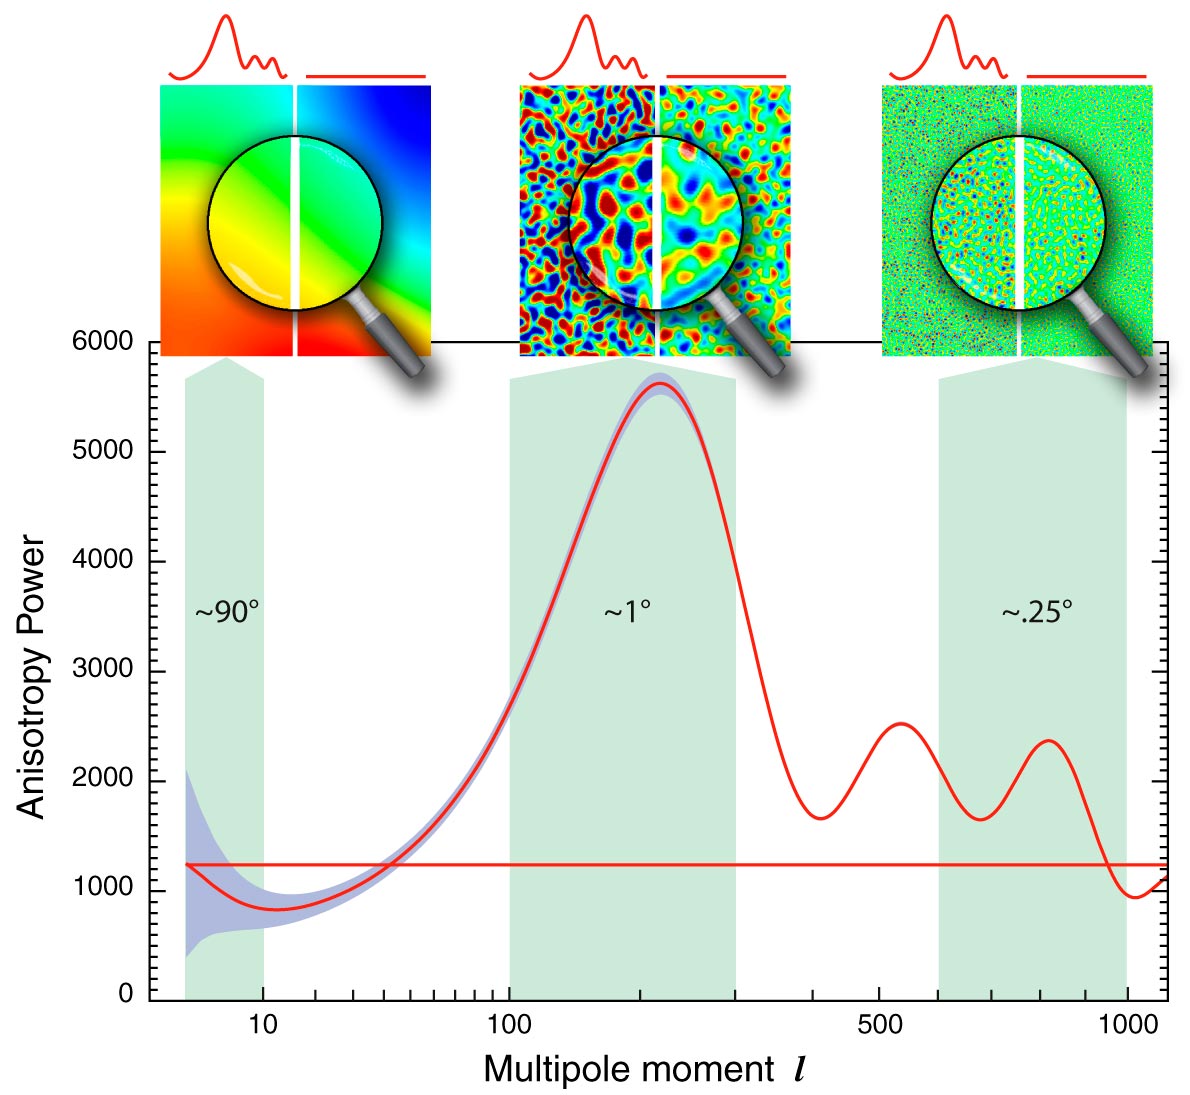
On the largest length scales (left side of the graph) the main source of temperature fluctuations are due to variations in the strength of gravity at the time of last scatter. Photons that must climb out of a gravitational potential well will lose some energy and as a result, the radiation reaching us from that direction will appear slightly dimmer or cooler than average, and vice-versa. Since the universe appears to be dominated by some form of dark matter that has yet to be directly observed, the variations in the gravitational potential are largely determined by variations in the density of the dark matter. It is unclear what mechanism established these variations to begin with (remember that the early universe is almost featureless) but many cosmologists believe that a period of inflation may have produced the dark matter/gravitational variations a small fraction of a second after the Big Bang. The COBE satellite first detected fluctuations on these angular scales in 1992.
As one moves to smaller angular scales (to the right on the graph) one starts to see the imprint of sound waves moving through the ionized hydrogen gas. Recall from the previous page that photons, electrons, and protons behave much like a single fluid before the epoch of last scatter, so any regions where the density of protons and electrons are higher than average (a region of compression in a sound wave) will also be a region where the photon density is higher, and vice-versa. When the radiation decouples from the hydrogen gas at the time of last scatter the waves will "freeze out" because the gas has lost its ability to support waves (the photons were providing an important source of pressure or "stiffness"). Thus a region in compression at this time will appear to us as a region that is brighter or hotter than average and vice-versa.
Try our Build a Universe interactive tool. You can play with the various parameters that generate the graph above. Try to match the real Universe's fingerprint.
The Sonic Horizon
Most cosmologists believe that sound waves were induced in the hydrogen gas in response to the gravitational fluctuations set up shortly after the Big Bang (perhaps by the episode of inflation). Since these waves have only 375,000 years to live, they can only move for a limited distance (or oscillate a certain number of times) before freezing out. This distance is called the "sonic horizon" and sets a fundamental length scale in the early universe. The first and largest peak in the above spectrum corresponds to sound waves that were just starting their first period of compression when the freeze out occurred. (These are very low frequency sound waves!) The succesive peaks correspond to higher frequency waves alternately caught in periods of rarefaction and compression at the time of last scatter. The relative heights and locations of these peaks are the signature of the gas properties at the time of last scatter.