
Other Images
Images > Other Images > 7 YR CMB Angular Spectrum
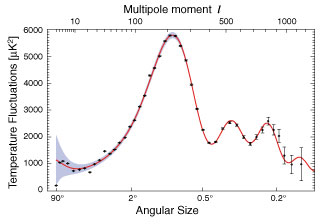
7 Year CMB Angular Spectrum
The "angular spectrum" of the fluctuations in the WMAP full-sky map. This shows the relative brightness of the "spots" in the map vs. the size of the spots. The shape of this curve contain a wealth of information about the history the universe.
Based on the 7 year data release.
Credit: NASA / WMAP Science Team
Available formats:
129 x 90 JPG (3 KB)
320 x 224 JPG (14 KB)
640 x 447 JPG (31 KB)
1073 x 750 JPG (99 KB)
3148 x 2200 JPG (321 KB)
PDF (38 KB)
WMAP # 111133