
CMB Images
Images > CMB Images > CMB Temperature & Polarization
CMB Temperature & Polarization
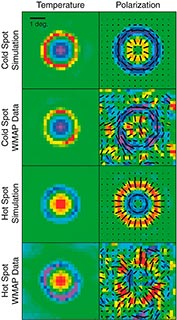
With the 7-year results, WMAP has produced a visual demonstration that the polarization pattern around hot and cold spots follows the pattern expected in the standard model.
The standard model predicts a specific linked pattern of temperature and polarization around hot and cold spots in the map. WMAP now sees the predicted pattern in the map, as shown in the figure.
Credit: NASA / WMAP Science Team
Available formats:
160 x 90 JPG (5 KB)
320 x 177 JPG (22 KB)
640 x 354 JPG (112 KB)
1024 x 566 JPG (304 KB)
2048 x 1132 PNG (71 KB)
4096 x 2264 PNG (155 KB)
WMAP # 101079