
Three Year Results on the Oldest Light in the Universe
Press Release
3YR. RESULTS Press Release: Web Link / RTF_doc
NASA Press Release: Web Link
The Microwave Sky
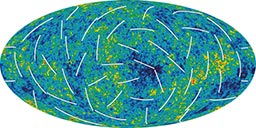
Credit: NASA/WMAP Science Team
WMAP has produced a new, more detailed picture of the infant universe. Colors indicate "warmer" (red) and "cooler" (blue) spots. The white bars show the "polarization" direction of the oldest light. This new information helps to pinpoint when the first stars formed and provides new clues about events that transpired in the first trillionth of a second of the universe.
White Bkgd - JPG(83 Kb) PNG(934 Kb) PNG(2.6 Mb) TIF(12.2 Mb)
Black Bkgd - JPG(128 Kb) PNG(950 Kb) PNG(2.7 Mb) TIF(12.2 Mb)
Time Line of the Universe
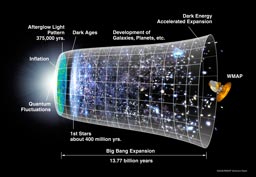
Credit: NASA/WMAP Science Team
The expansion of the universe over most of its history has been relatively gradual. The notion that a rapid period "inflation" preceded the Big Bang expansion was first put forth 25 years ago. The new WMAP observations favor specific inflation scenarios over other long held ideas.
With Text - JPG(96 Kb) JPG(388 Kb) JPG(1.8 Mb)
Without Text - JPG(76 Kb) JPG(292 Kb) JPG(1.6 Mb)
Content of the Universe
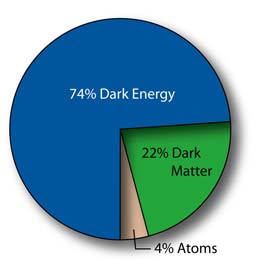
Credit: NASA/WMAP Science Team
WMAP data reveals that its contents include 4% atoms, the building blocks of stars and planets. Dark matter comprises 22% of the universe. This matter, different from atoms, does not emit or absorb light. It has only been detected indirectly by its gravity. 74% of the universe, is composed of "dark energy", that acts as a sort of an anti-gravity. This energy, distinct from dark matter, is responsible for the present-day acceleration of the universal expansion.
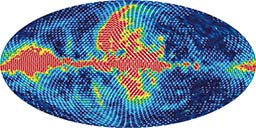
Full-sky Temperature Maps -Polarized Light
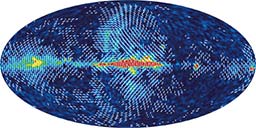
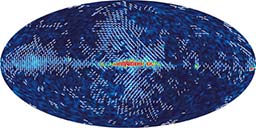
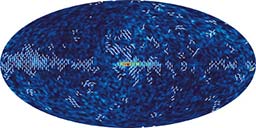
The color represents the strength of the polarized signal seen by WMAP - red strong/blue weak. The signal seen in these maps comes mostly from our Galaxy. It is strongest at 23 GHz, weakest at 61 and 94 GHz.
This multi-frequency data is used to subtract the Galactic signal and produce the CMB map shown (top of this page). These images show a temperature range of 50 microKelvin.
K-Band Map (23 GHz)
JPG (160 Kb)
PNG (760 Kb)
PNG (2.1 Mb)
Credit: NASA/WMAP Science Team
Ka-Band Map (33 GHz)
JPG (128 Kb)
PNG (680 Kb)
PNG (1.8 Mb)
Credit: NASA/WMAP Science Team
Q-Band Map (42 GHz)
JPG (120 Kb)
PNG (624 Kb)
PNG (1.7 Mb)
Credit: NASA/WMAP Science Team
V-Band Map (61 GHz)
JPG (100 Kb)
PNG (588 Kb)
PNG (1.6 Mb)
Credit: NASA/WMAP Science Team
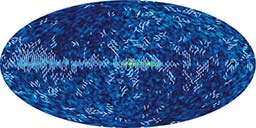
W-Band Map (94 GHz)
JPG (120 Kb)
PNG (652 Kb)
PNG (1.8 Mb)
Credit: NASA/WMAP Science Team
The CMB Angular Spectrum
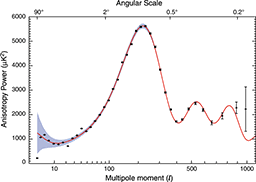
Credit: NASA/WMAP Science Team
The "angular spectrum" of the fluctuations in the WMAP full-sky map. This shows the relative brightness of the "spots" in the map vs. the size of the spots. The shape of this curve contain a wealth of information about the history the universe.
The CMB Angular Spectrum
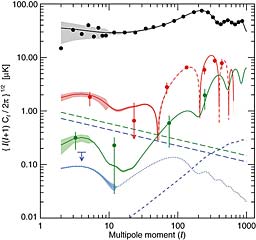
Credit: NASA/WMAP Science Team
Like the graph above, this shows the relative polarization strength of the spots in the map vs. the size of the spots (red, green, and blue curves). WMAP has now measured the red and green curves. This new information helps to pinpoint when the first stars formed and provides new clues about events that transpired in the first trillionth of a second of the universe.
Scientific Impact of WMAP Results
In February 2003 WMAP released results from the first year of flight data. The Team described, in 13 papers spanning 241 journal pages, the data processing, calibration, systematic error analysis, and other critical aspects of the experiment. The data were made readily accessible for scientists to analyze.
Thomson ISI, an information company, reported a WMAP paper as the "Hot Paper in Physics" in the months Feb, May, June, July, Aug, Sept, Nov, and Dec, 2004, and in Feb, Mar, May, June, Aug, Sept, Oct, Dec, 2005.
ISI also issued a list of "Super Hot Papers," the top 103 science papers "... that have been consistently "hot" (that is, highly cited during a succession of bimonthly counts) for more than a year now. So these are the papers that scientists publishing today are judging to be particularly significant and useful." They are "at a level notably above papers of comparable type and age. Tracking current citations to these relatively recent papers provides an insight into areas of notable concentration and activity in today's research." The #1 and #2 papers on the list were from WMAP, the only space science papers on the list of 103 Super Hot Papers. Science Watch highlighted the impact of WMAP papers in an articled, "Microwave Probe: All Hits, All the Time from WMAP."
Greg Davidson's 2003 science news metric report of January 24, 2004 says, "The Wilkinson Microwave Anisotropy Probe (WMAP) had the most productive single year by this metric of any Explorer mission. [It] accounted for 1.1% of world science with discoveries relating to the shape of the universe, dark matter, and early galaxy formation."
The WMAP 3-year data release contains more than three times as much data as in the 1-year release. The analysis has improved considerably, and the new ability to use the combinations of individual single-year data sets is a boon for systematic error analyses.
WMAP Mission Background
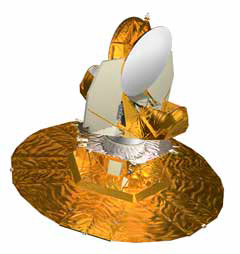 The WMAP Observatory has a back-to-back
optical system that provides for differential measurements of the sky. The upper portion, above the white cylinder, is
passively cooled by the large vertical radiator plates. The bottom shield protects against the strong microwaves from the Sun
and Earth.
The WMAP Observatory has a back-to-back
optical system that provides for differential measurements of the sky. The upper portion, above the white cylinder, is
passively cooled by the large vertical radiator plates. The bottom shield protects against the strong microwaves from the Sun
and Earth.
The WMAP (then MAP) mission was proposed to NASA in 1995 and selected in April 1996 as a MIDEX mission administered by the Explorers Program. The WMAP Team proposed a predominantly non-redundant spacecraft with a lean mission operations and data analysis approach.
WMAP was launched on June 30, 2001 from the Cape Canaveral Air Force Base aboard a Delta II rocket.
WMAP completed its prime 2 years of mission operations in its L2 orbit by September 2003. Meanwhile, the 2002 and 2004 Astronomy and Physics Senior Review granted WMAP mission extensions, endorsing the proposed 8-years of mission operations, to end September 2009.
In February 2003 the WMAP Team released a set of 13 papers (241 journal pages) along with flight data from the first year of observations of the CMB. In March 2006, the WMAP Team released 3-year data, including full polarization data, and papers describing the data processing, systematic error analyses, calibration, and other critical aspects of the experiment.