Expansion of the Universe
Long Description (Return to Concepts page)
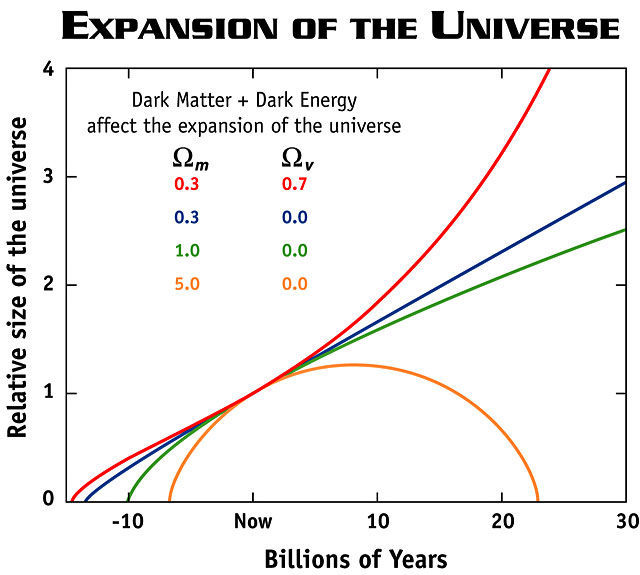
Possible scenarios for the expansion (and possibly contraction) of the universe: the bottom orange curve represents a closed, high density universe which expands for several billion years, then ultimately turns around and collapses under its own weight. The green curve represents a flat, critical density universe in which the expansion rate continually slows down (the curves becomes ever more horizontal). The blue curve shows an open, low density universe whose expansion is also slowing down, but not as much as the previous two because the pull of gravity is not as strong. The top (red) curve shows a universe in which a large fraction of the matter is in a form dubbed "dark energy" which is causing the expansion of the universe to speed up (accelerate). There is growing evidence that our universe is following the red curve.