
Other Images
Images > Other Images > 5 YR CMB Angular Spectrum
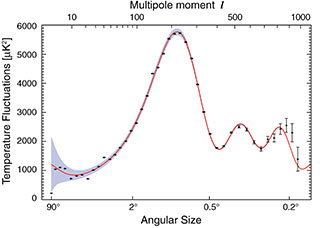
5 Year CMB Angular Spectrum
The "angular spectrum" of the fluctuations in the WMAP full-sky map. This shows the relative brightness of the "spots" in the map vs. the size of the spots. The shape of this curve contain a wealth of information about the history the universe.
Based on the 5 year data release.
Credit: NASA / WMAP Science Team
Available formats:
160 x 90 JPG (2 KB)
240 x 171 JPG(7 KB)
320 x 228 JPG (14 KB)
380 x 270 JPG (15 KB)
1024 x 729 JPG (70 KB)
3080 x 2194 JPG (237 KB)
PDF (38 KB)
WMAP # 080999